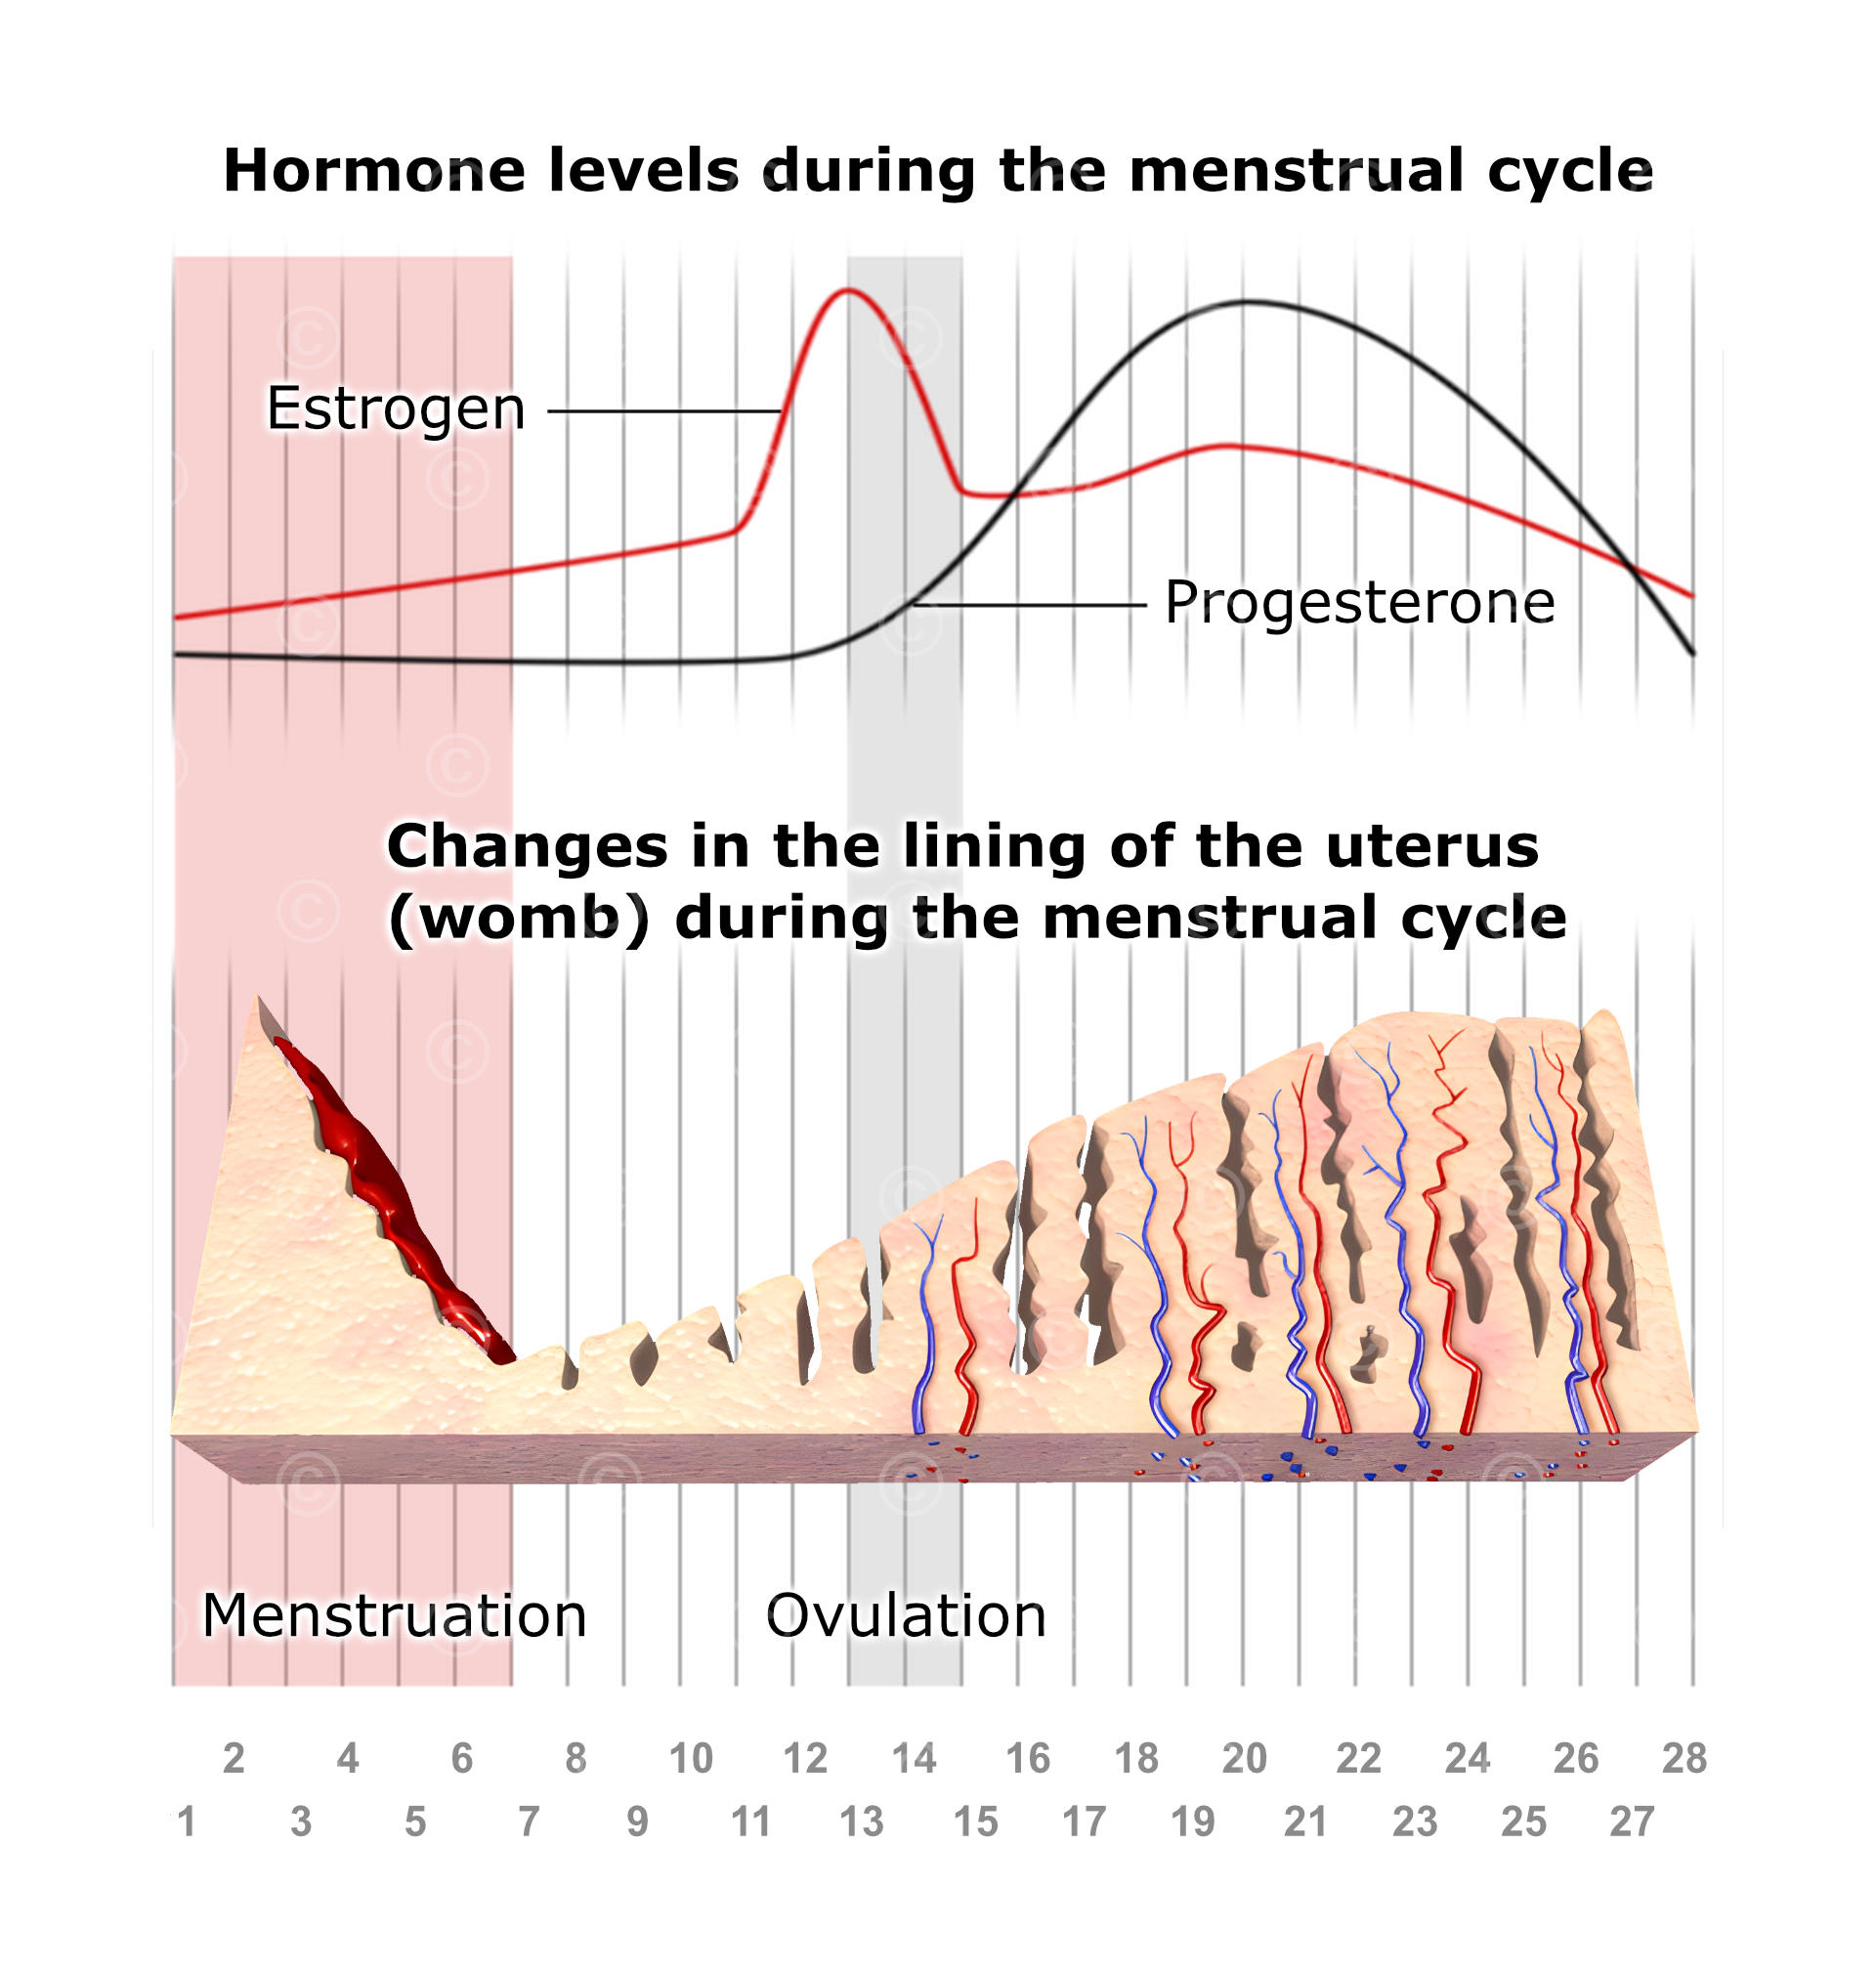
Schematic illustrations describing the menstrual cycle with a focus on showing how the structure of the endometrium changes over the monthly cycle depending on the presence of progesterone and estrogen.
The graph starts on the left with mensturation. This ends on day 7, but by day 11 estrogen increases and triggers ovulation. Progesterone levels rise and the endometrium continues to build up. On the 28th day menstruation starts.
Project details:
Content: Illustration menstrual cycle
Utilization: Patient information website
Specifications: 640 * 480 pixel
Client: Dimensional / Gesundheitsinformation.de – IQWIG
The rights of use of the illustrations shown are with the respective clients.